Tracking asset usage is crucial for optimizing resource management, reducing costs, and improving efficiency. By monitoring how and when assets are used, organizations can identify patterns, prevent overuse or theft, and schedule timely maintenance, thereby extending the lifespan of valuable equipment. This proactive approach ultimately leads to better allocation of resources, increased productivity, and a stronger bottom line.
Find out how Hector can help you better track your assets through our easy to follow guide.
Requirements

- Have an Armor or Castle plan
- Have access to the Settings > Assets section
Getting Started
To start tracking usage in your organization, navigate to the Settings > Assets section.
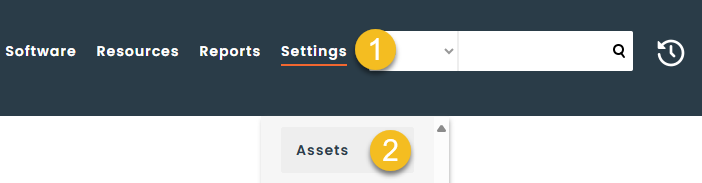
Next, click on the Usage rate tab to access the configuration
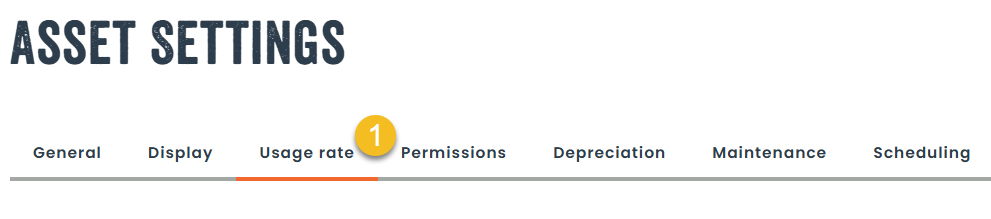
Configuration
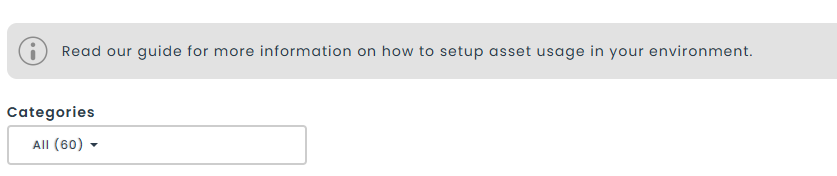
Step 1: Setup your categories
You can use the Categories multiselect to specify which categories will be eligible for usage tracking in the app.
If you exclude a category from usage tracking, that category will not be visible in reports, dashboard and other areas on the software. But don’t worry, you can always change your mind and add a category at a later moment.
Step 2: Manually track usage
There are three ways to log manual usage of an asset.
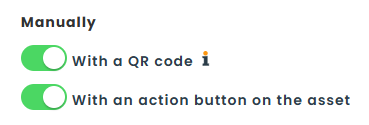
1. With a QR code.
When scanned, the QR code will create a usage event against the asset that was scanned. For example, you can scan a tool when you’re about to use it and Hector will take care of the rest. It is not necessary to be connected to Hector to scan the QR code. It can be scanned from your photo app, the Hector Mobile App, or directly in the Search bar in the Hector Web App.
You must have the Castle plan in order to use the QR code method.
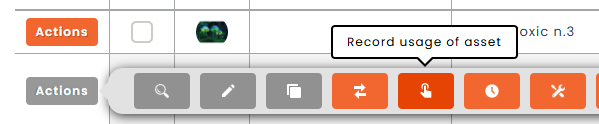
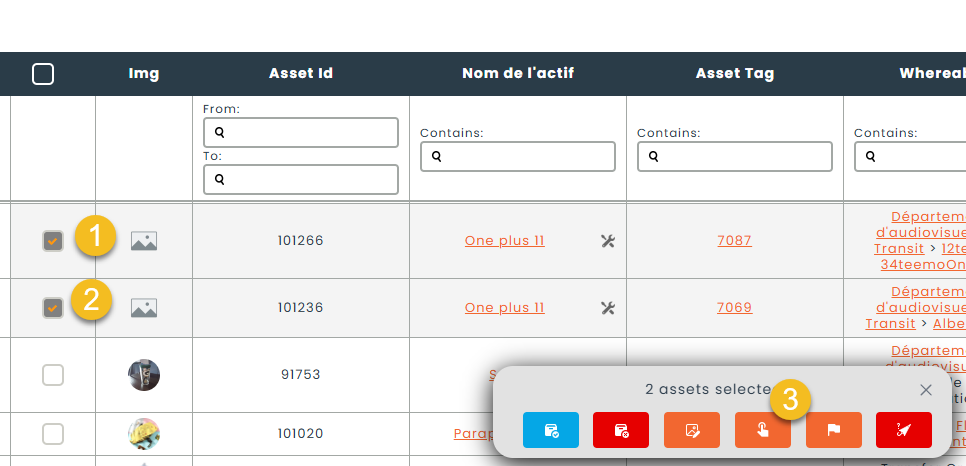
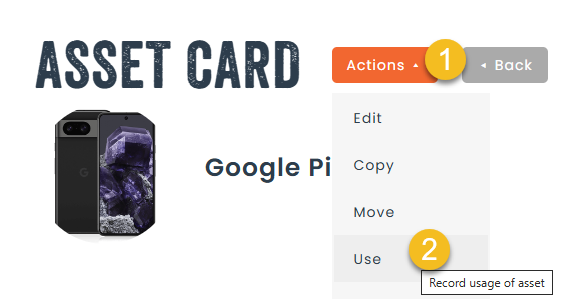
2. With an action button on the asset.
You can also record an asset’s usage through a button available in the App. To do so, you must navigate to an asset, or select one or multiple assets in a list, and the click on the Asset Usage button.
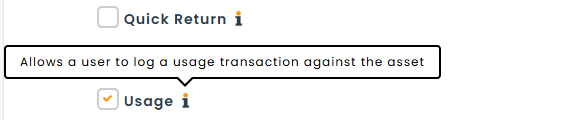
You can also control which roles can see the usage button from the Settings > Roles > Inventory > Asset section.
3. Through an API call
If you are familiar with API calls, you can perform the Use action through the /assets/{assetId}/use POST route.
Step 3: Automatically track usage
If you want Hector to do the heavy lifting, and automatically record usage with transactions already occurring within the application, you can setup tracking for different events in the application.
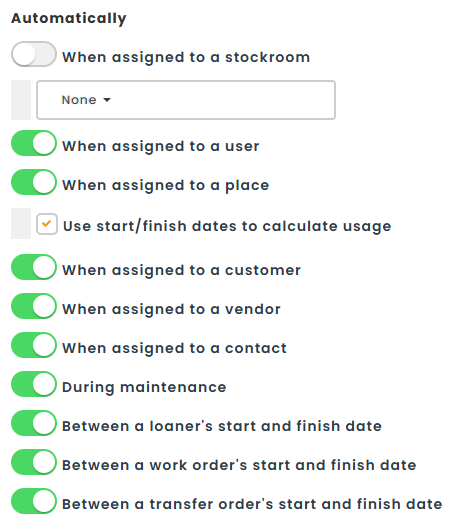
- When an asset is assigned to a stockroom, Hector will record a usage event for each day the asset was in the stockroom. You can activate the option and then filter which stockrooms can be used for usage calculation.
- When an asset is assigned to a user, the asset will be considered in use, and Hector will record a usage event for every day the asset was in the user’s possession.
- When an asset is assigned to a place, the asset will be considered in use, and Hector will record a usage event for every day the asset was in the place. Furthermore, a start and finish date can be set for a Place, and these days can be used to further restrict which days can be considered for asset usage.
- When an assigned is assigned to a customer, vendor or contact, Hector will record a usage event for every day the asset was assigned.
- Hector can record an asset usage event for every day an asset maintenance is performed against the asset.
- When a loaner, work order or transfer order is completed, an asset usage event will be created for every day the asset was on record.
Step 4: Track usage with Integrations
Some integrations in Hector have a date when the asset was last used. Hector can use this information to record a usage event against the asset.
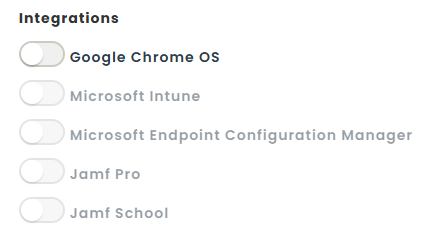
In the example above, we can track the usage of a Google Chrome device by activating the Integration. Hector will then check the Last Connected Date column in the Google Device Integration in order to record usage of the device.
If the integration is grayed out, this means it has not been purchased or activated in your environment.
Step 5: Week Days
Hector can use your business days to better understand when to record a usage event. For example, if your organization is closed on Saturdays, you can uncheck this option. Hector will ignore usage stats for Saturdays, in order to give a better indication of when assets were actually used.
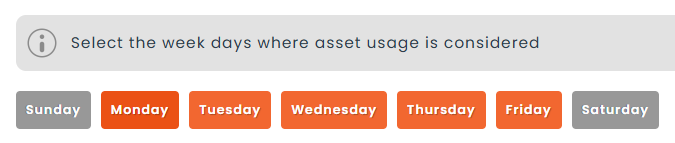
At the time being, it is not possible to provide specifics days when your organization is closed, but this feature will be added through a future update.
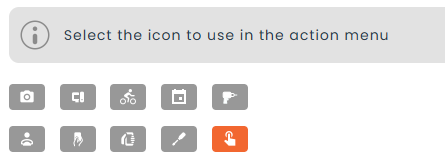
Step 6: Choose an icon
If you don’t like the default icon selected by Hector, you can select another from the provided list.
Step 7: Calculation
Hector calculates asset usage once per day. If you would like to recalculate usage after having made changes to the configuration, you can click on the “Recalculate usage” button. The job can take anywhere from a few seconds to a few minutes depending on how many assets you have in your environment.
Display, Dashboard & Reporting
Once usage configuration has been performed, new sections will appear in Hector allowing you to see usage statistics for your assets in multiple areas of the software.
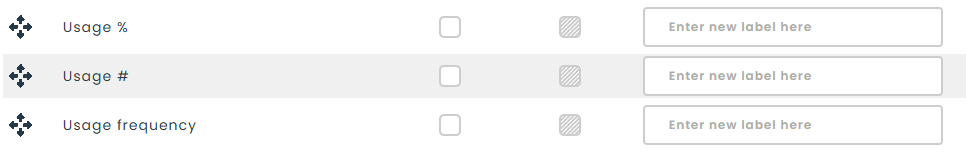
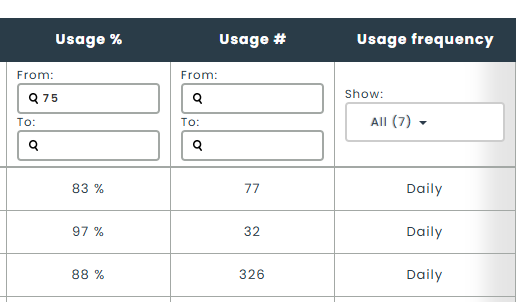
Grids & Columns
Three new columns are available for asset and part grids from the column setup pages. These columns will display usage information in the form of a percentage, a count or a frequency measured in days, weeks, months, or years. You can then filter the data like any other column in the application.
Asset, Part and Category Pages
If you navigate to any asset, part or category, a new usage rate box is available at the top right corner of the page. If you click on the box, you will be able to browse usage history over time.
Dashboard
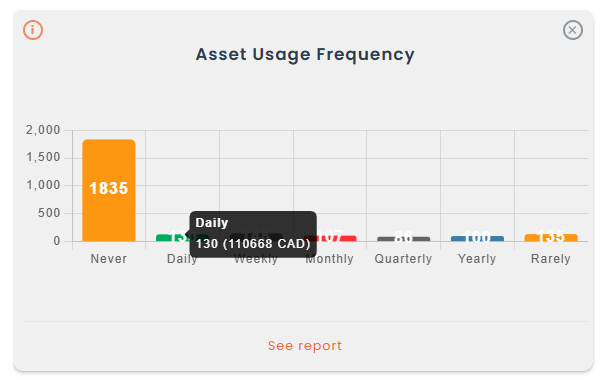
New dashboard tiles can be added to the home page containing information for assets, parts and categories. Here is a recap of the available tiles, as well as an example of the Asset Usage Frequency tile.
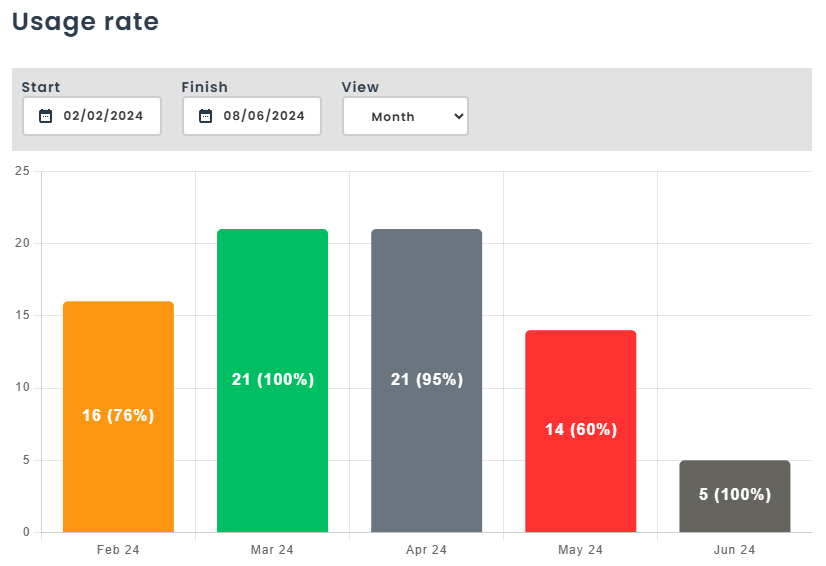
- Usage rate % will show the usage percentage of assets in the last four months.
- Usage rate # will show the usage counts of assets in the last four months.
- Most used will show the most used assets, parts or categories depending on the tile you choose to show on the home page.
- Least used will show the least used assets, parts or categories. The asset, part or category must have at least been used once to show on the tile.
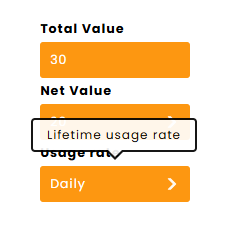
- Asset usage frequency will show usage grouped as Daily, Weekly, Monthly, Quarterly, Yearly, Rarely or Never been used. A net value will also show in the popup to get a better idea of the value of “sleeping” assets.
Reporting
Many new reports have been added to track asset usage by asset, part or category. These reports can be shown/hidden by role. Here are some examples of the reports that have been added.
Assets
- Usage Summary
- Contains asset usage grouped by frequency with a sum of the value of the assets.
- Usage Details
- Contains the details of assets usage over time.
- Most used
- Shows a list of assets sorted by most to least used.
Parts
- Usage Details
- Contains the details of parts usage over time.
- Most used
- Shows a list of parts sorted by most to least used.
Categories
- Usage Details
- Contains the details of categories usage over time.
- Most used
- Shows a list of categories sorted by most to least used.
Next steps
Would you like to get started with asset usage in your environment but not quite sure where to begin? Our team is here to help, simply click on the following link to get some help from our team.